
Lineage
A mouse colony management platform for the records and decisions that run a colony: cages and animals, breeding, genotyping, daily work, and a traceable history.
Learn more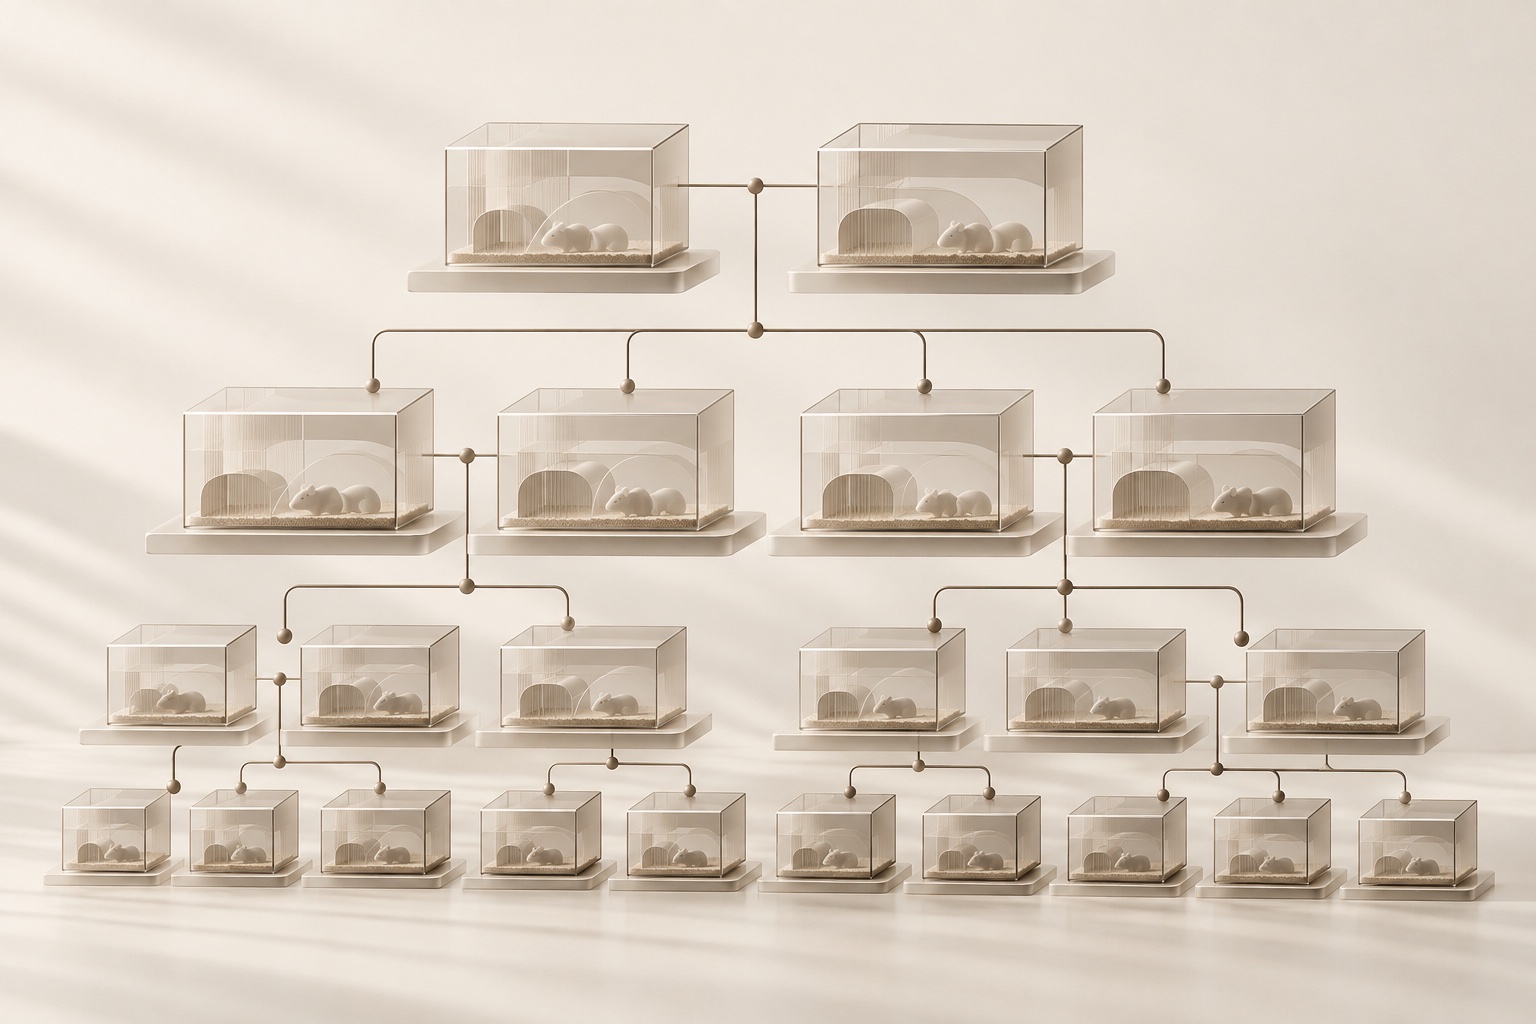
Research depends on methods, records, and decisions that are specific to each lab. We work with researchers to turn that knowledge into tools their teams can use — from colony operations and image analysis to participant recruitment and data pipelines.
What this looks like in practice
For research labs losing weeks to manual analysis
You bring the methods, the operating constraints, and the judgment behind the work. We bring software engineering and quantitative analysis. Together, we define the workflow, build the tool, validate it against your lab's baseline, and refine it with the people who use it. Documentation and training make it a system your team can own and run.
A mouse colony management platform for the records and decisions that run a colony: cages and animals, breeding, genotyping, daily work, and a traceable history.
Learn more
Validated image-analysis workflows for microscopy and histology, from measurement and quality control through batch export and review. QuPath may be part of the workflow, not the boundary.
A study recruitment and participant registry platform connecting researchers with people who may qualify for their studies. CuraOS brings study discovery, participant intake, and eligibility matching into one workflow, helping research teams reach relevant communities and coordinate recruitment.
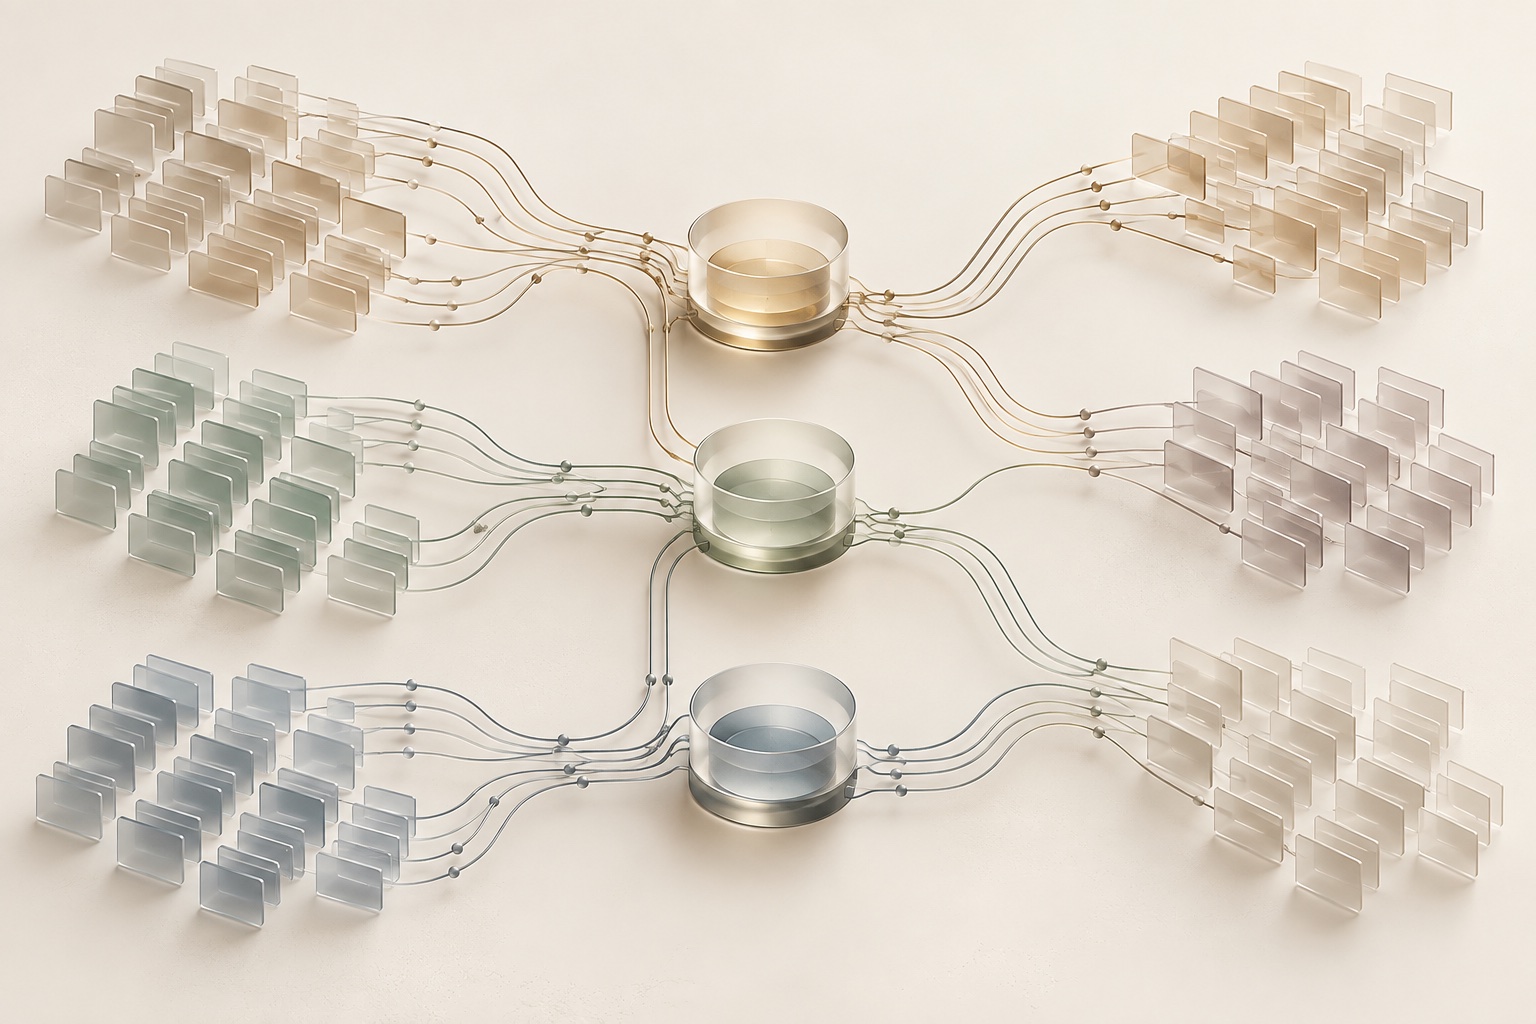
R and Python workflows that clean, join, QC, and model your experimental data — logistic regression, count, survival, and mixed-effects models — producing reproducible tables and figures instead of a folder called FINAL_v3.
Why Laminar
Cardiovascular biology at UVA's Sonkusare Lab. We have done the manual analysis we automate.
Neuroscience and Statistics at UVA. R and Python daily. We know if the model is right, not just if the code runs.
MOVAT/PSR histology, colony databases, vascular stats — already deployed and run day-to-day by lab members, not engineers.
Start with a conversation about your methods, your team, and the decisions your tools need to support.